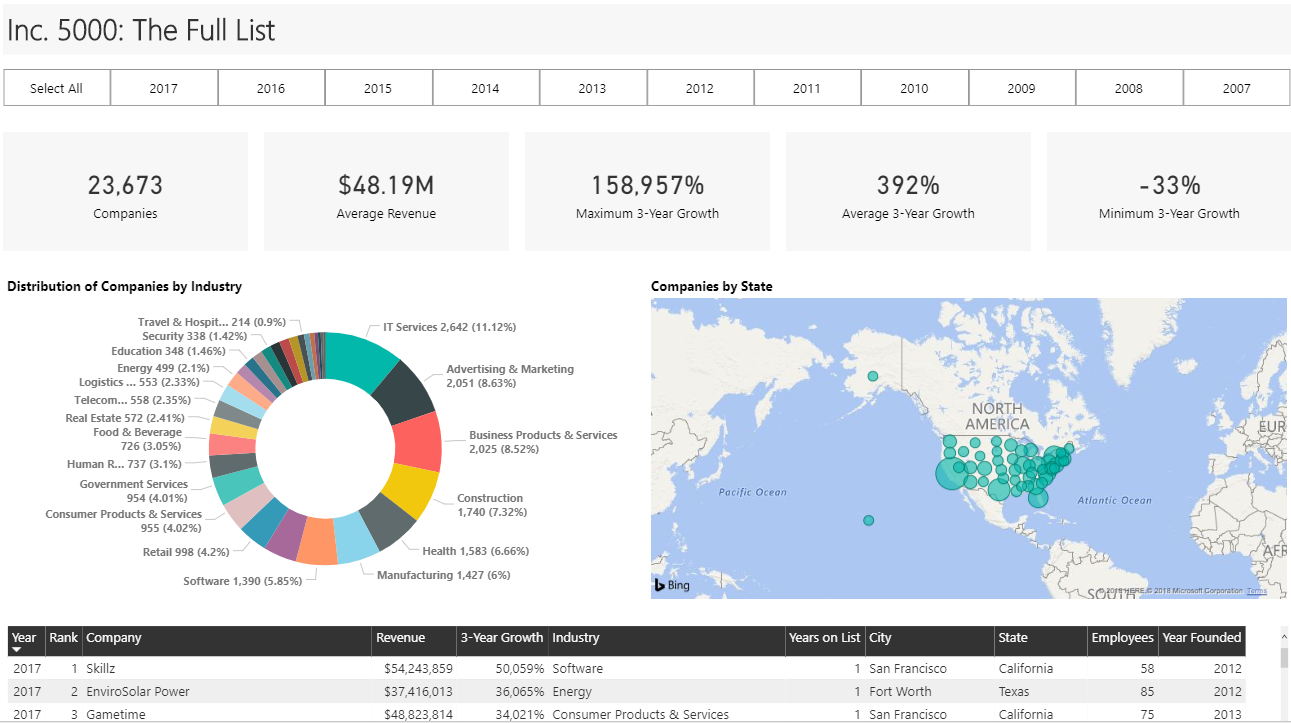
Collects 11 years of Inc. 5000 data and transforms it into easy-to-use interactive visuals for entrepreneurs.
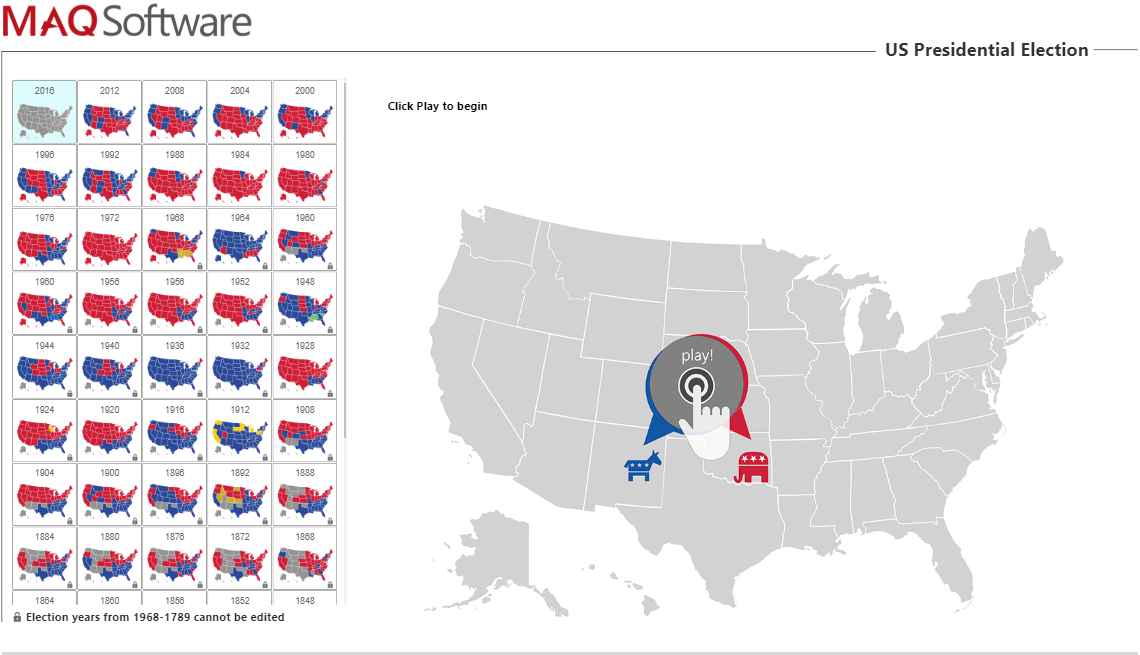
Lets users view historical election results and forecast future outcomes from any touch-screen device.
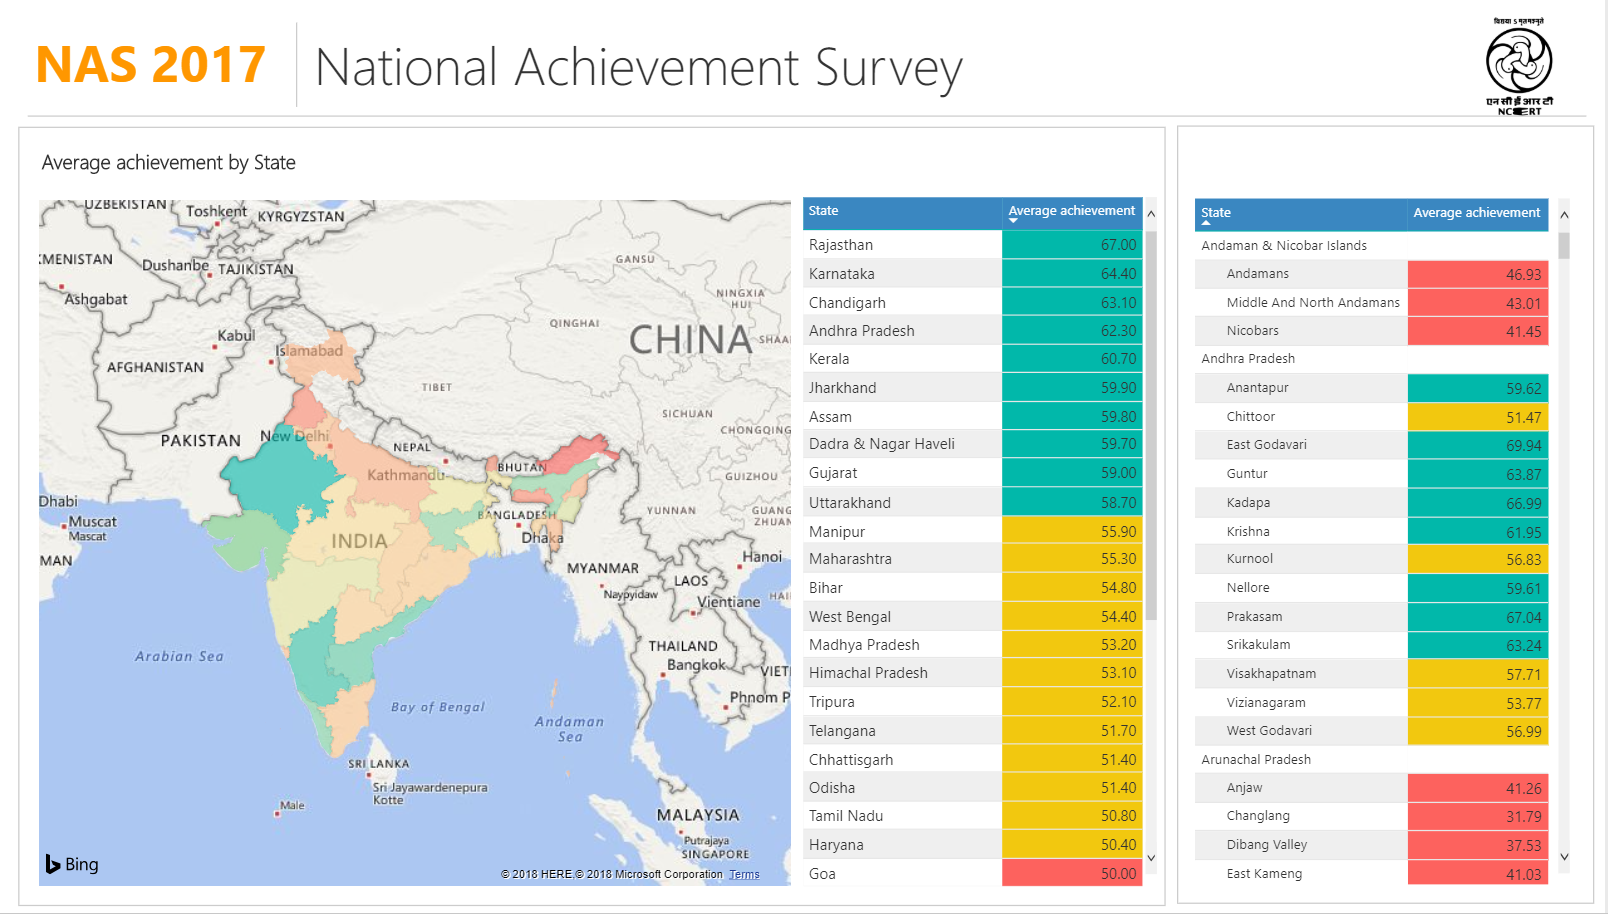
Lets users visualize the data of the National Achievement Survey using the highly interactive features of the Power BI.


