
Business Case:
Every year, Inc. magazine publishes a list of the 5,000 fastest growing private companies in America. The list, called the Inc. 5000, has existed in its current form since 2007. The Inc. list includes statistics about each company, including the company's previous year's revenue, industry, year founded, 3-year sales growth rate, number of employees, and location.
We wanted to analyze the Inc. 5000 data and share our insights on successful companies. Our analysis needed to be publicly accessible without requiring the installation and maintenance of additional servers.
We created a Power BI solution to collect 11 years of Inc. 5000 data and transform it into easy-to-use interactive visuals for entrepreneurs. The Power BI solution is shared on a public URL and is open for public interaction.
Key Challenges:
- Allow users to interact with Power BI report from any device without installing any software.
- Create a shared report without writing new code or putting extra load on the web server.
- Create reports that are accessible to users unfamiliar with Power BI.
- Allow users to sort results by year, industry, company, state, and frequency on the list.
Solution:
We created a Power BI report that pulls data from a large data source and compiles it into interactive visuals on a publicly accessible website.
Key Highlights:
- Pulls data from the online data source and generates report with zero html coding.
- Publishes to cloud-based Power BI report which is, accessible on any device.
- Uses Power BI as service to avoid extra load on our web server.
- Allows users to control sorting and display parameters.
We prepared the Inc. 5000 data in an Excel spreadsheet before incorporating it into the Power BI report. We then published the report to the web, which is an option available to all Power BI Pro account holders. This allowed access to the Power BI report from any web-enabled device. This also eliminated the need to store the Inc. 5000 data on a separate database server. Finally, we embedded the Power BI report in a frame on our website.
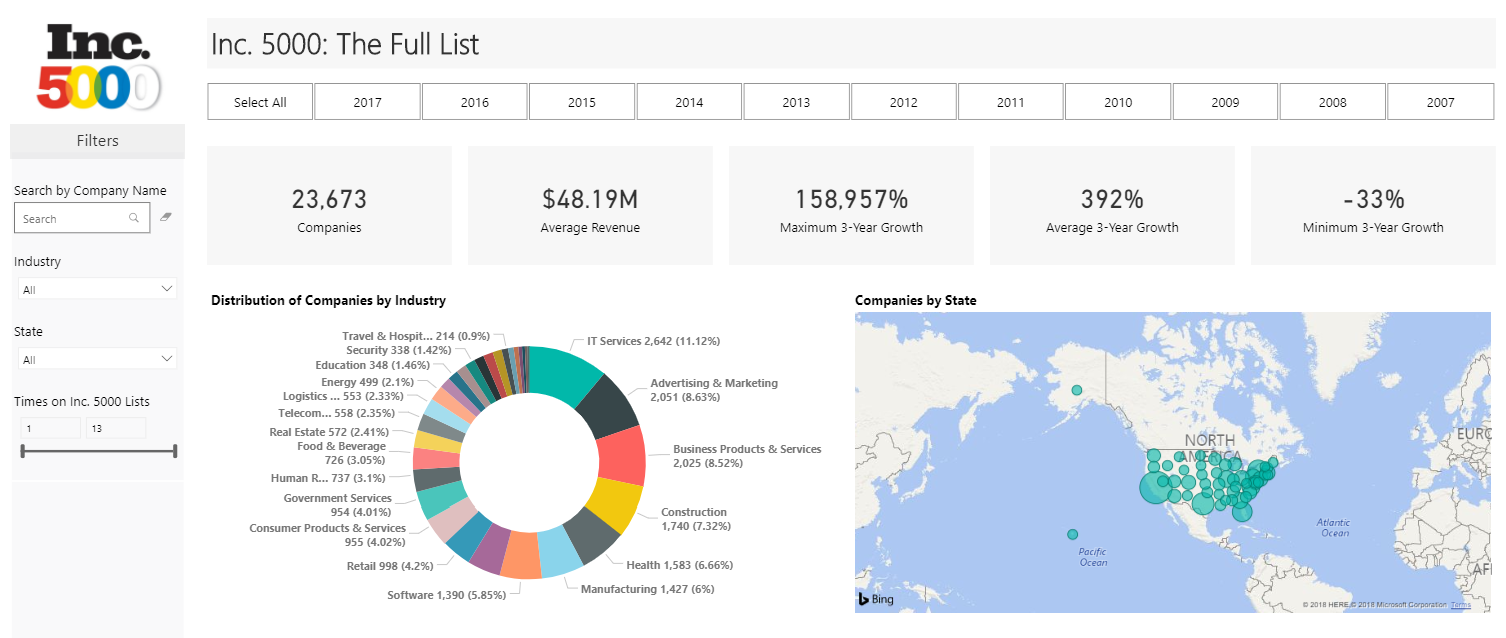
Figure 1: Initial screen for Inc. 5000 analysis
The Power BI report loads with an overview of the compiled data for 11 Inc. 5000 lists. Users can see the total number of companies that made the lists (out of 55,000 spots), the average revenue for each company, the maximum 3-year growth, the average 3-year growth, and the minimum 3-year growth. Users can also see a ring chart displaying the most prevalent industries and a map showing the locations of companies.
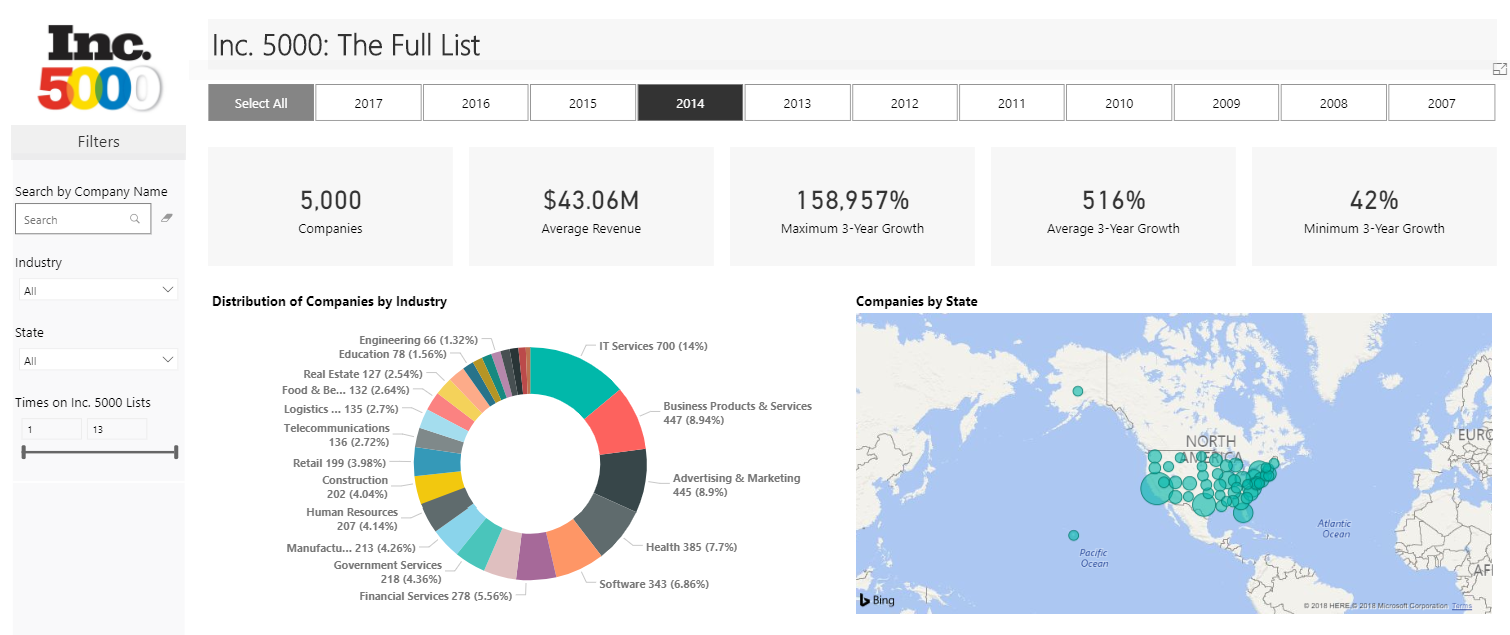
Figure 2: Dashboard with only the year 2014 selected
The prominent buttons at the top of the dashboard allow users to select individual years or combinations of years. The statistics, ring chart, and map update automatically when a different year is selected. Users can narrow results using the search box or sort by industry, state, or times on the list.
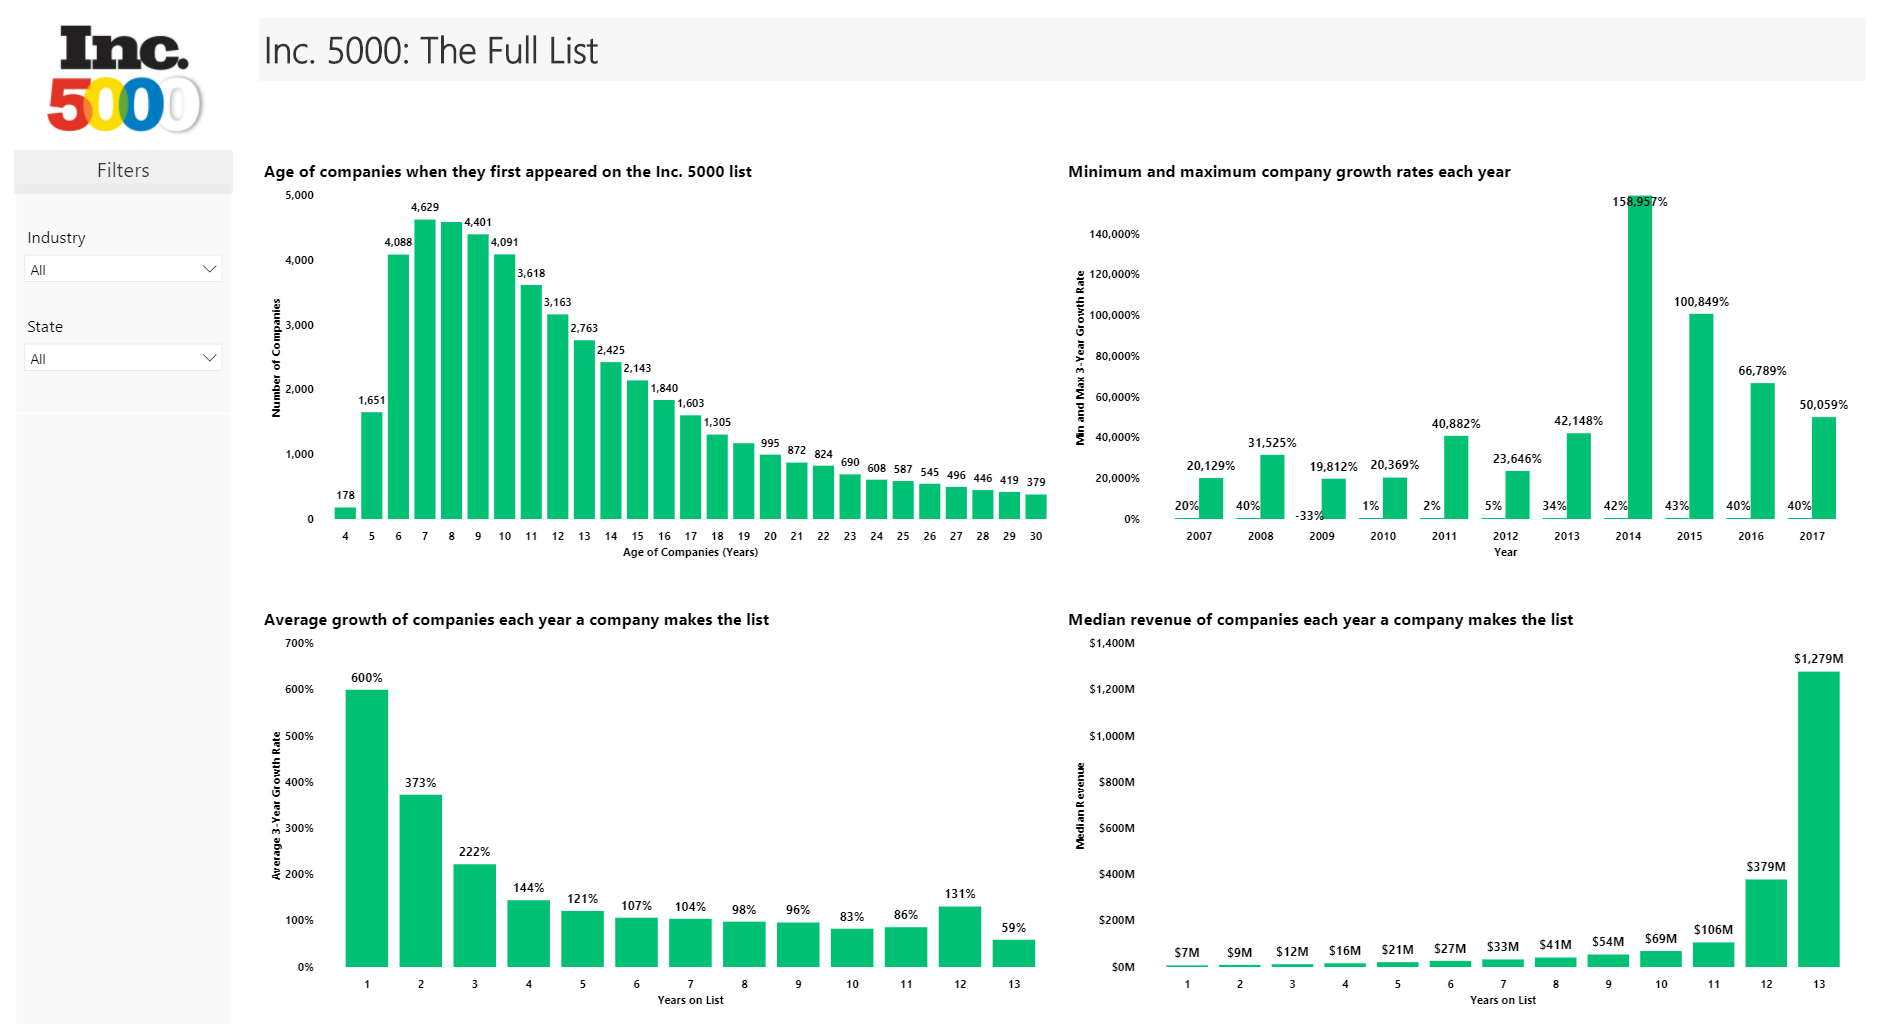
Figure 3: Average age, growth, and median revenue charts
The second page of the Power BI dashboard contains charts detailing the age of companies when they first appeared on the list, the minimum and maximum growth rates each year, the average growth, and the median revenue of companies each successive year they made the list. Users can filter these charts by industry and state.
Business Outcome:
The Inc. 5000 Power BI report lets users interact with data that would normally occupy 55,000 lines on an Excel spreadsheet. Using Power BI, we were able to create an interactive report, accessible on any device, without requiring html coding or adding extra strain to our web servers.
Outcome Highlights:
- Embedded Power BI dashboard into website for easy access.
- Saved server resources by using Power BI’s hosted web service.
- Saved time by eliminating the need for html coding to share the report on the web.
- Saved time by creating interactive visuals in place of lengthy spreadsheets.