
Business Case:
The more Power BI reports an organization creates, the more difficult navigation becomes for users. Enterprise-level Power BI users often search through hundreds of reports, many of which are not applicable to their job duties. Power BI web navigation improves usability but requires a pro license for each user. With out-of-the-box non-pro license implementations, users cannot share default views of reports or create dashboards that span multiple sources.
We addressed these issues by creating a framework that lets non-pro license users define their experiences based on job role. For example, account executives should be able to see a specific list of reports tailored to their needs. Executives should also be able to create their own custom rules to further improve the navigation experience.
Key Challenges:
- Create structured navigation of Power BI reports.
- Allow users to build reports from multiple Power BI sources (individual charts or whole reports).
- Create unique experiences for individual users by pulling charts from different dashboards or reports (or individual visuals).
- Create global filters where users can save a parameter once and every report will show only data for that parameter.
Solution:
We created a custom app that tailors users’ Power BI experience to their individual needs, allowing for easy navigation and the creation of custom reports.
Key Highlights:
- Role-based filtering rules.
- N-level hierarchical navigation.
- Customizable metadata.
- Users can create custom reports without the help of developers.
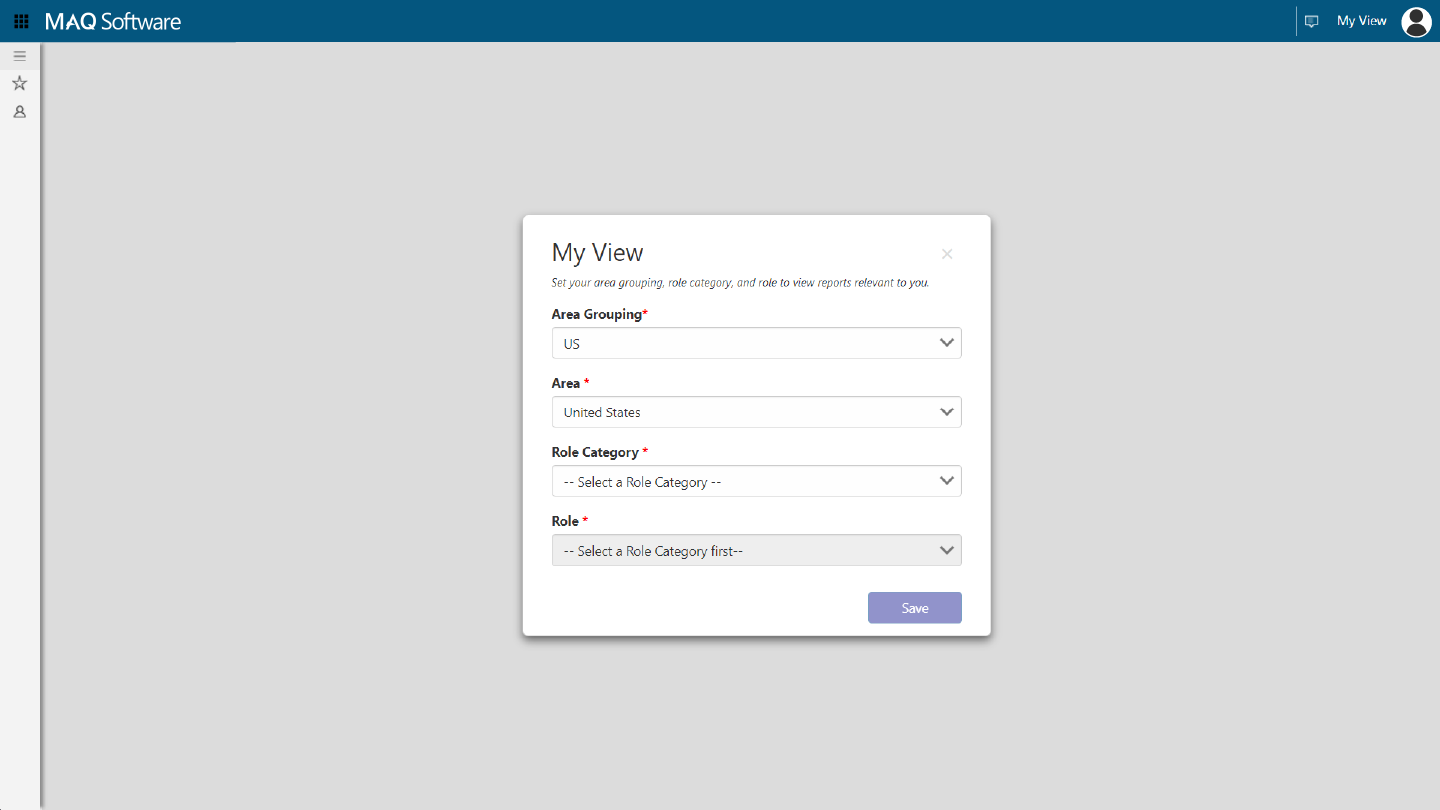
Figure 1: Role selection prompt
Users begin by selecting their role and role category (Figure 1). Reports are tailored depending on the role selection. Next, users can choose specific reports with the navigation menu along the left side of the app (Figure 2).
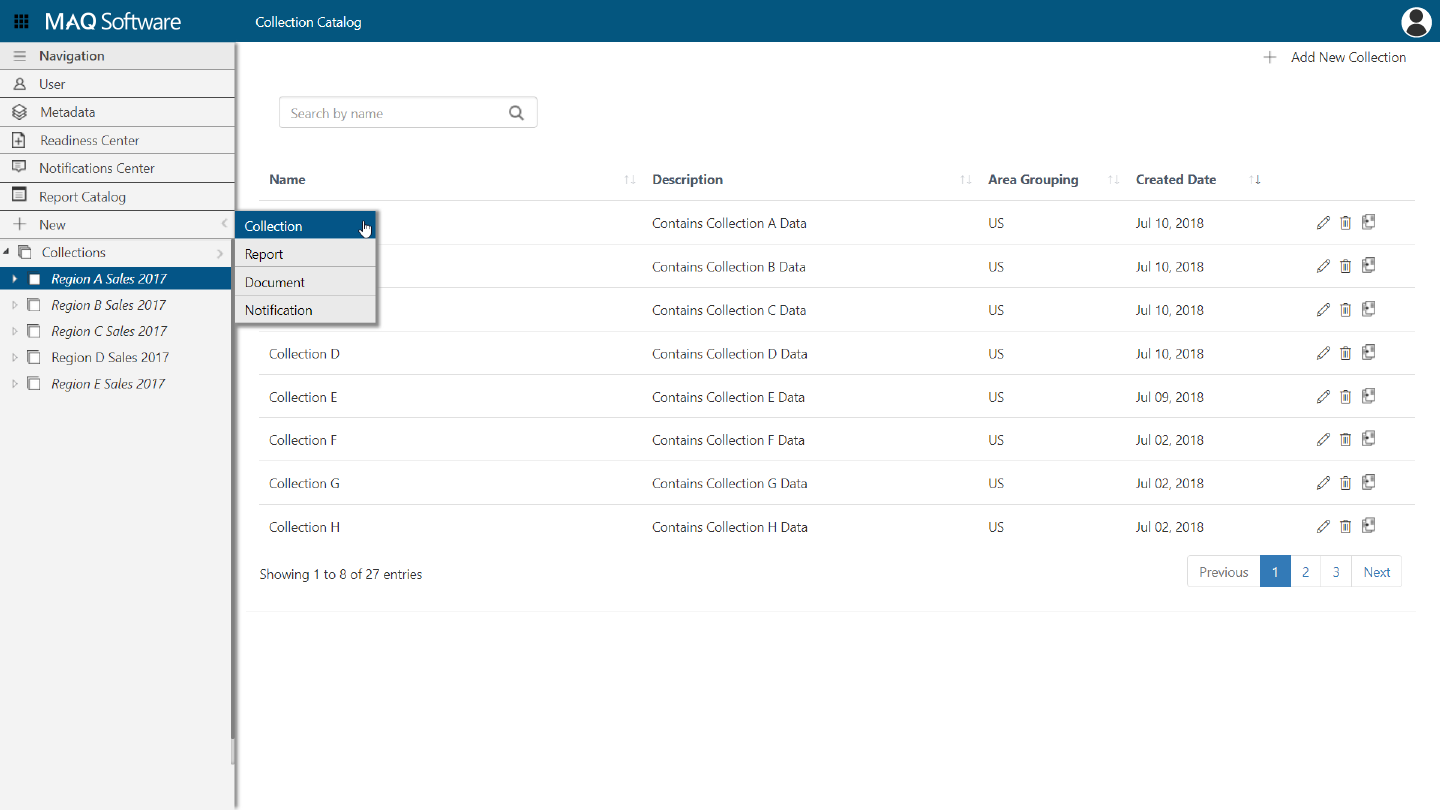
Figure 2: Navigation screen
The menu allows hierarchical navigation of reports with as many levels as needed and is customizable (Figure 2). Once a report is selected, it is displayed in the right-hand frame. The report display is not limited to Power BI: Tableau, D3, or any other type of report can be displayed.
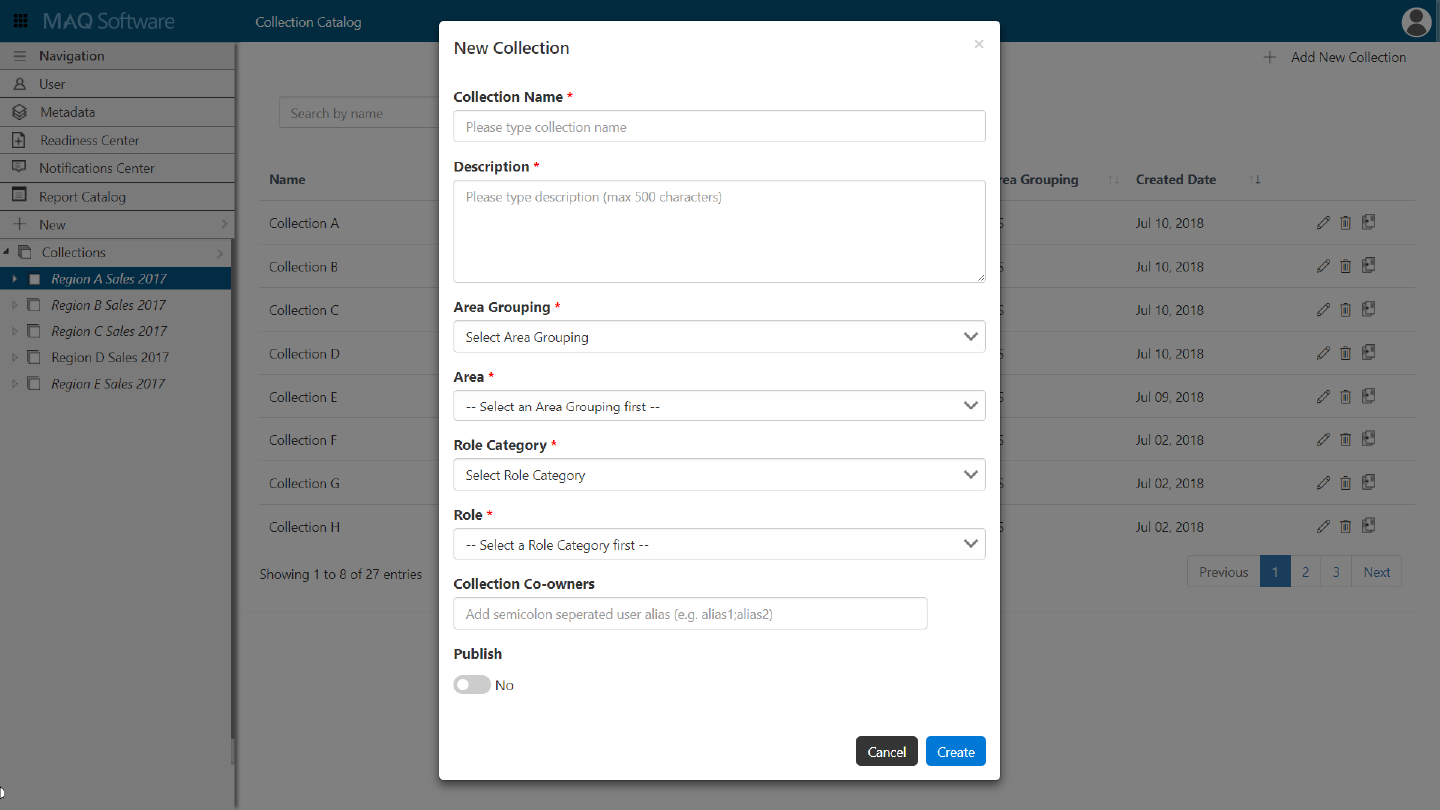
Figure 3: Navigation customization
Users can select global filters that communicate with all reports. For example, a user can select a filter to only show data from the fiscal year 2017. Once applied, only data from 2017 will be shown on all reports. Users can also add unique metadata to reports detailing the data source, user concerns, or any other pertinent information.
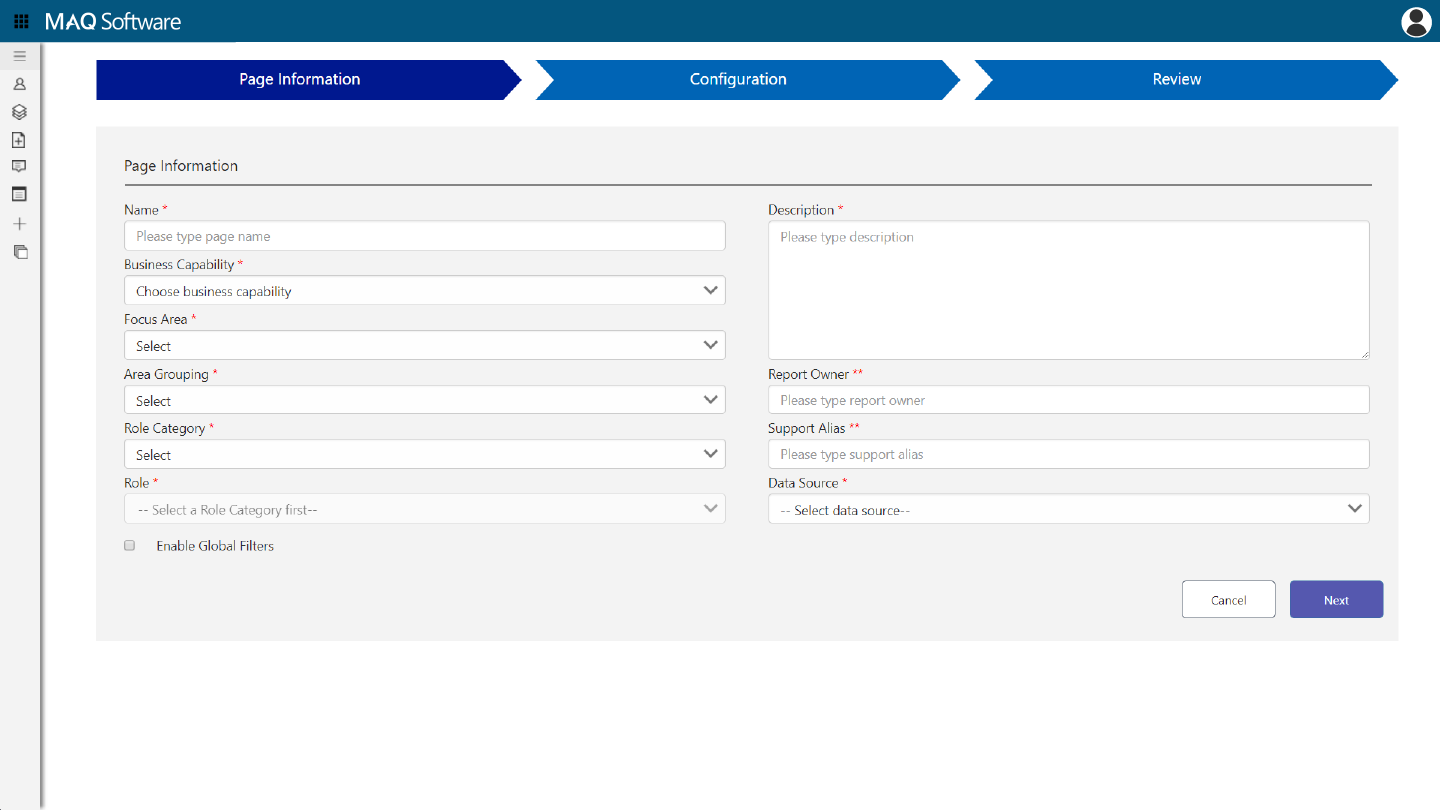
Figure 4: Custom report creation
Business Outcome:
Our custom global filter enhances the Power BI user experience with intuitive navigation, filters, custom report creation, and content that is tailored to each user.
Outcome Highlights:
- Significantly reduced costs by minimizing the need for pro licenses.
- Improved productivity by displaying the most relevant reports.
- Reduced costs by allowing administrators to make custom reports without the need for developers.